
ProductsBuilding Dashboard
Building Dashboard
Building Dashboard tracks and communicates patterns of real-time resource use in buildings in ways that engage, are easy to understand and make connections between resource conservation and resulting environmental and community benefits.
Oberlin College – Harkness Co-op
Example 1 of 3
See current use
Communicate electricity, water, and other resource data.
Put it in context
Compare patterns over time and with typical use.
Make it your own
Bring your organization’s data together in Dashboard Builder.
Make resource use visible
In a classroom, the school’s own resource data gives students a local example to explore. The dashboard connects the building they use every day with patterns of electricity and water use.
Oberlin Public Schools – Building Dashboard
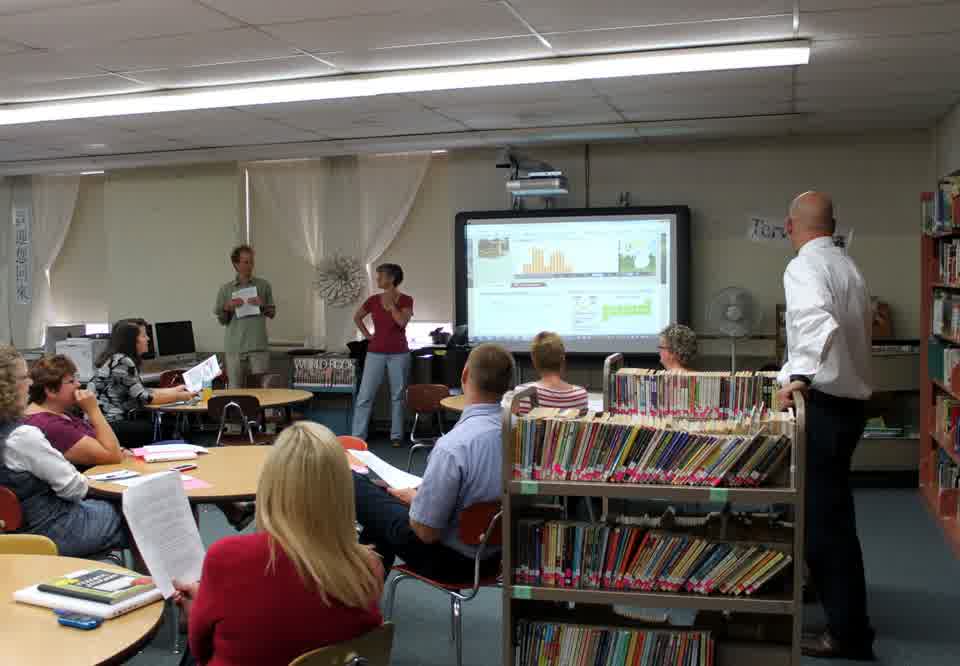
The same dashboard, on a screen students can read at Oberlin Public Schools.
Understand patterns
A time-series chart puts current use in context. This recorded Kahn Hall example compares electricity use over seven days with the building’s typical pattern.
Oberlin College — Kahn Hall
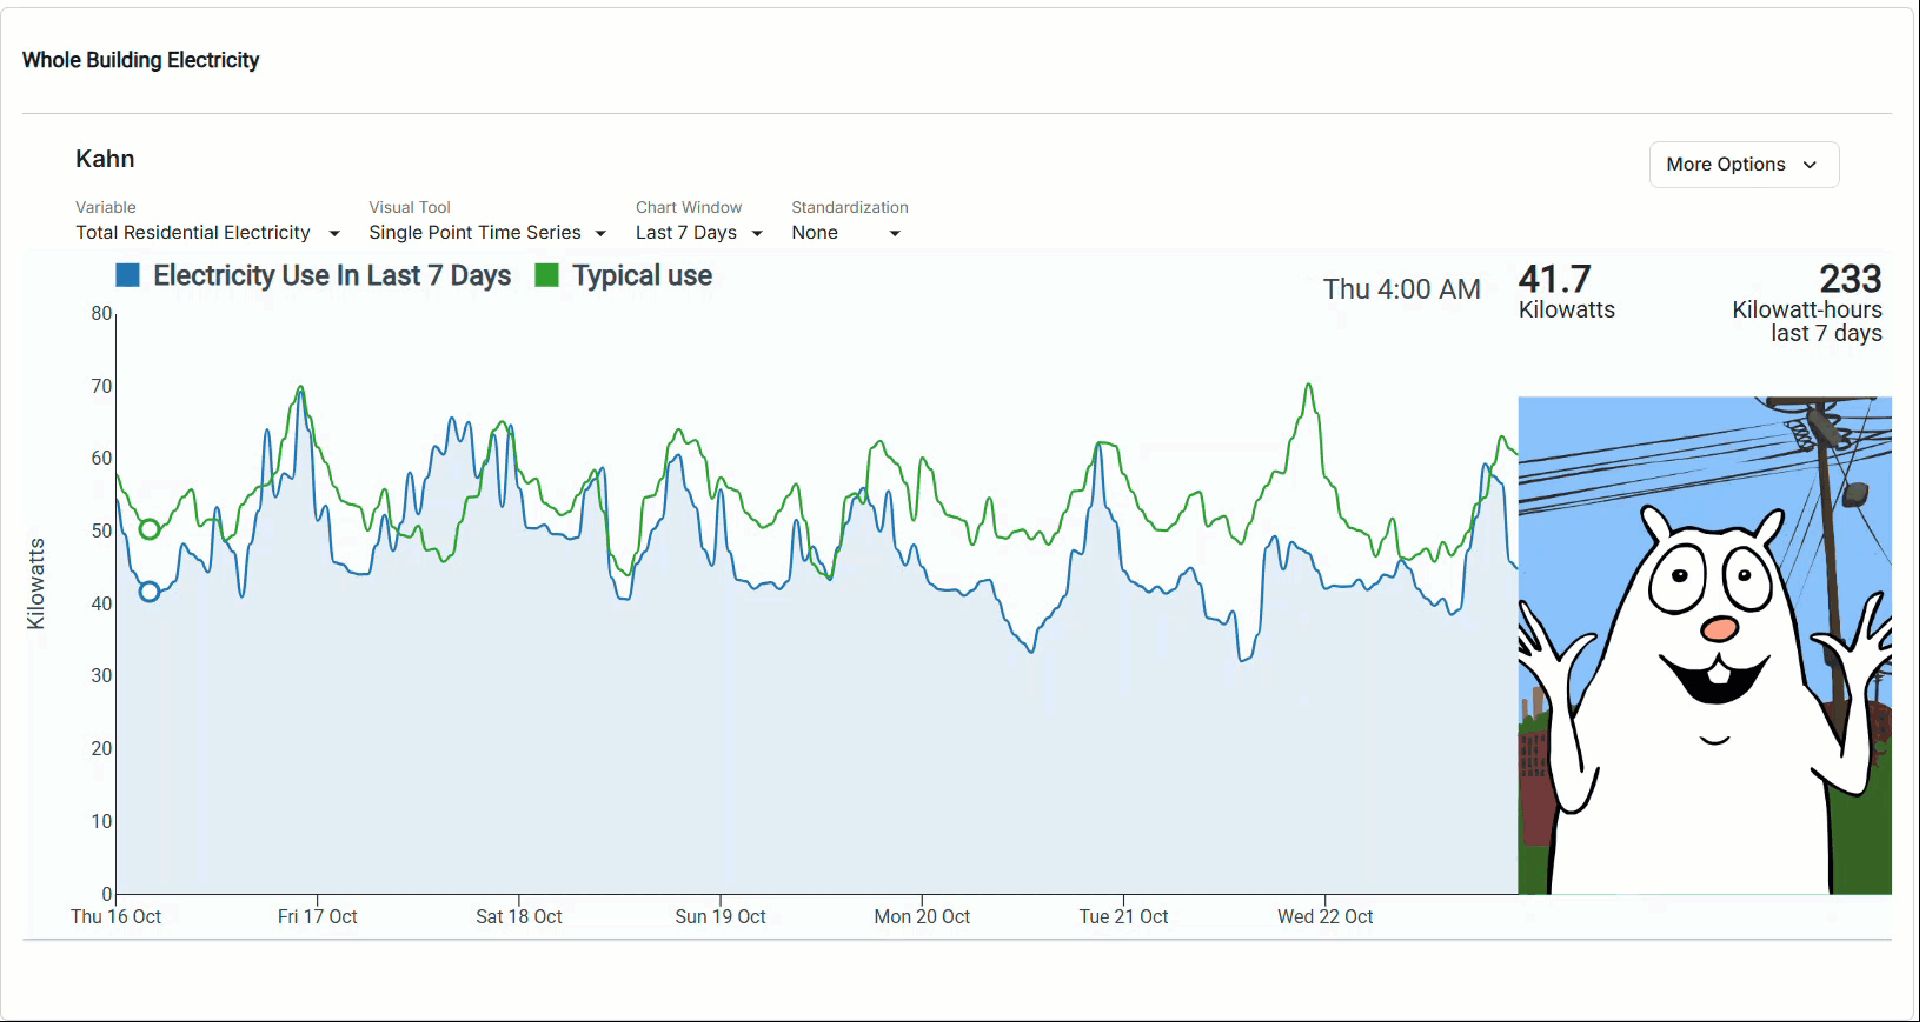
Kahn Hall, an Oberlin College residence hall, with the last 7 days of electricity against typical use.
Build your own dashboards
Community Hub gives clients the tools to build their own dashboards. Dashboard Builder brings resource data and visualizations together in a dashboard for their organization.
Oberlin Elementary — Building Dashboard
An example of a finished dashboard for a school. Scroll inside to explore the resource data.