
ProductsData Hub

Data Hub
Data Hub is a powerful and intuitive package of online data visualization tools. Data Hub makes it easy for managers, educators, students and communicators to translate real-time data acquired from a variety of sources into compelling visualizations that are easily understood and can be shared on websites and digital signage to tell stories of impact and opportunity.
Data Hub – Variables and visualization settings
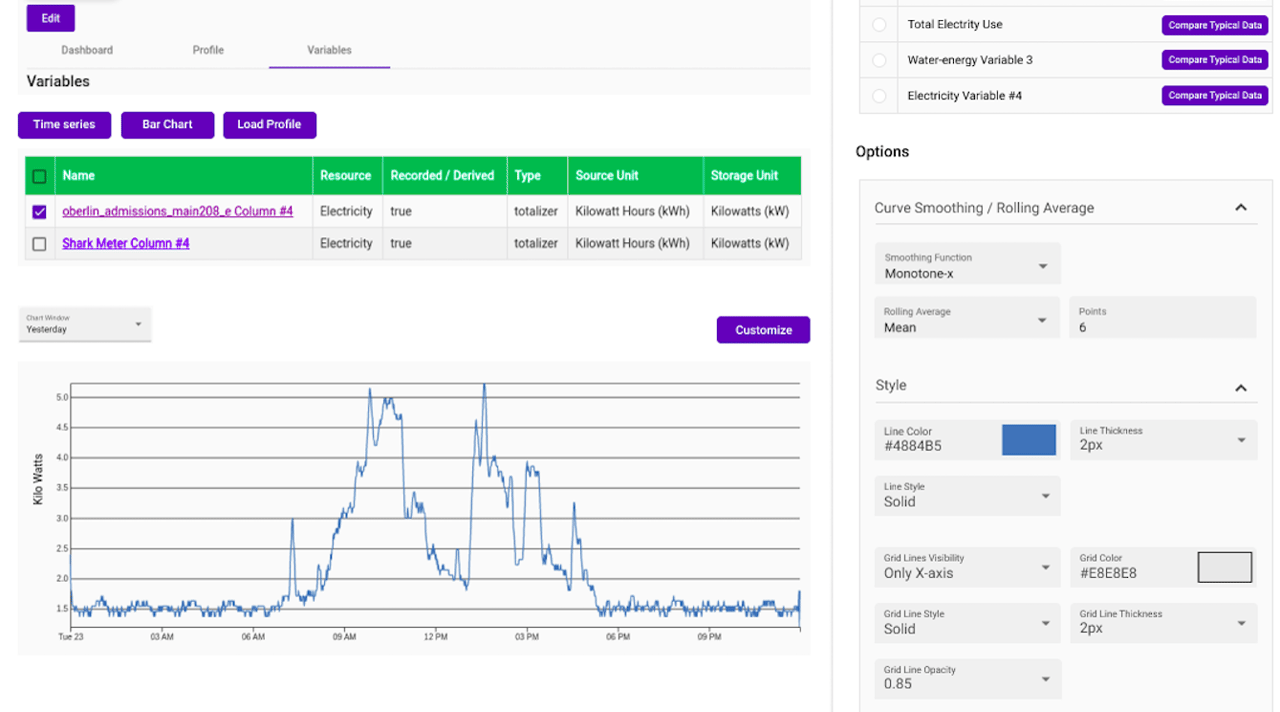
Example 1 of 2
Recorded Data Hub interface: variables, visualization settings and chart output.
Collect and manage
Bring measurements from different sources together.
Explore and visualize
Translate resource data into charts and comparisons.
Share the results
Publish visualizations on websites and digital signage.
Explore changes over time
Time-series charts show how resource use changes through the day. This live electricity chart is one of the public visualizations that can be shared independently of a full dashboard.
Oberlin — Electricity use
Find patterns in the data
A heat map makes patterns across hours and days visible. Explore this public electricity visualization to see one of the ways Data Hub turns measurements into information people can use.
City of Oberlin – Whole City Electricity Use