Dashboards
Four places that run Community Hub, with a link to each.

Who uses it
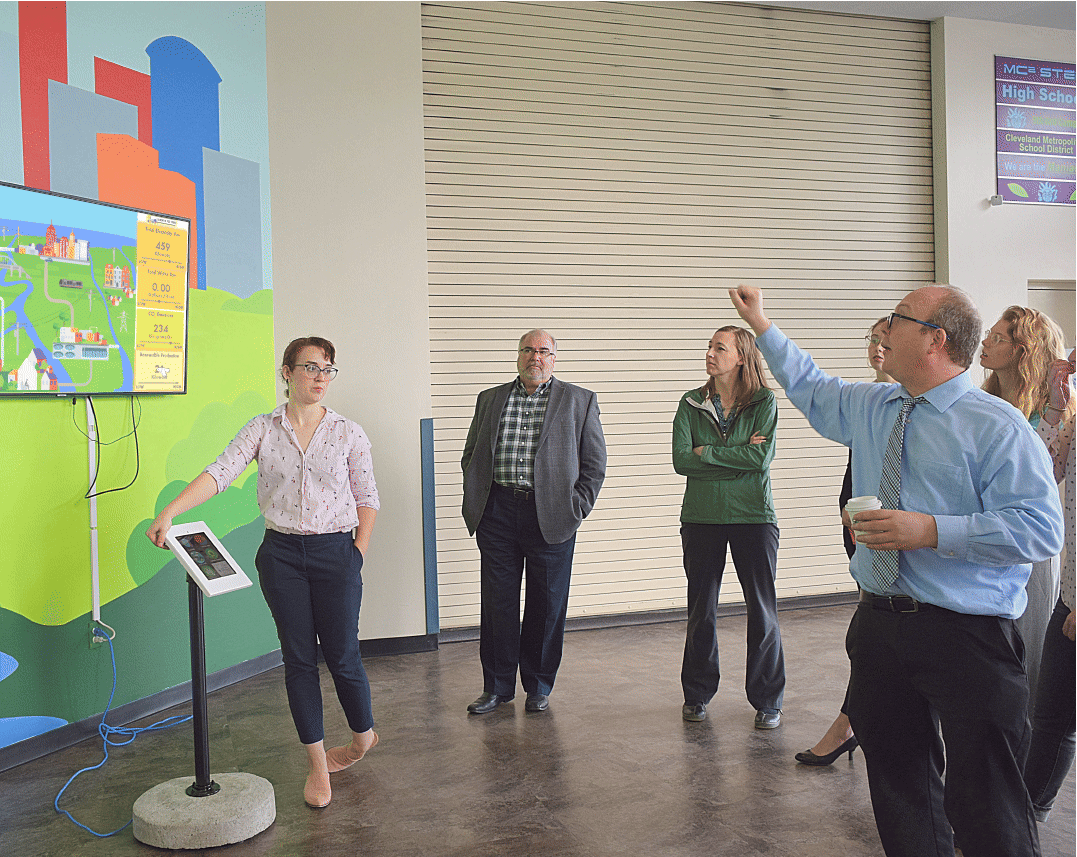
- The Great Lakes Science Center is one of Community Hub’s ongoing implementations.
- Its data comes from the center’s own monitoring equipment, Lake Erie (USGS) and an EPA air quality station in Cleveland.
- The exhibit has a screen and a touch kiosk.
- Cleveland’s version of the Citywide Dashboard runs there.
“The dashboard signage is stitching together the work of Cleveland organizations to make the team effort apparent”
How to read it
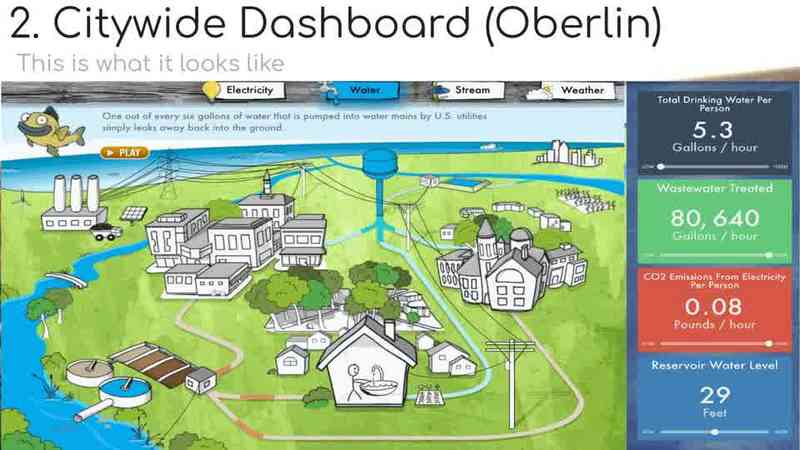
- Tabs switch between Electricity, Water, Stream and Weather.
- Gauges show current conditions: use, water quality and weather. A dot and line under each one compares now with the average, high and low.
- Animated flows match the current rate of use.
- Click a location for more detail. Flash the Energy Squirrel and Wally Walleye give facts and tips.
Results
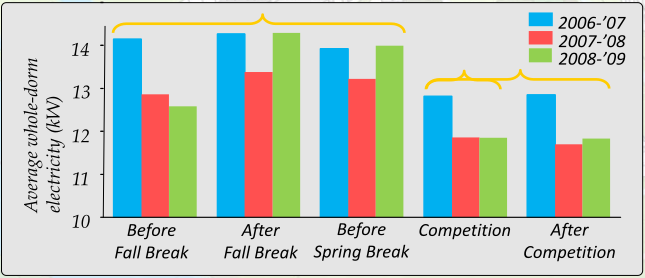
- The first electricity and water reduction competition was in 2006.
- The chart compares electricity use before, during and after the 2006–2009 competitions.
- Web hits rise during competitions, then drop. Feedback plus competition leads to conservation.
Bring one to your town
Proposed starting steps
- Talk with us and set goals.
- Map your data sources, including how Community Hub connects to your utility.
- Choose where people will see it.
- Build the first content.
- Run a pilot and a baseline assessment.
- Grow with partners and sponsors.
Oberlin’s citywide dashboard takes data each minute from the utility and the water and wastewater plants.
Start small. MidTown’s pilot started at four sites and reached 10 locations by January 2026.