Implementations
Explore Community Hub in communities, schools and organizations. Each place has its story and its whole live dashboard.
Cities and Neighborhoods
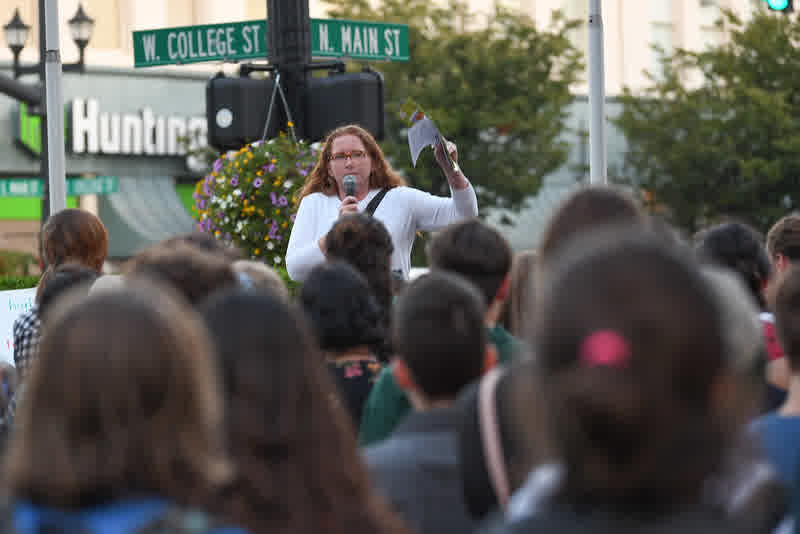
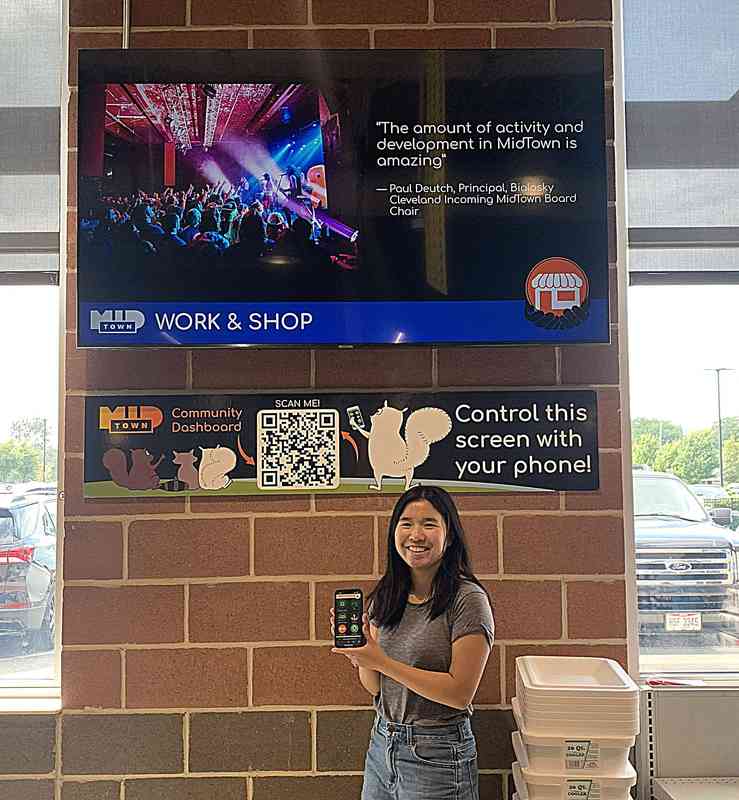
Citywide dashboards, a community calendar and public screens that show live electricity, water and air data. In neighborhoods, a shared calendar, jobs board and public screens keep shops, clinics, pantries and housing connected.
MidTown Cleveland
Neighborhood
Neighborhood partners sharing a calendar and dashboard, from shops to community centers.
K–12 Schools
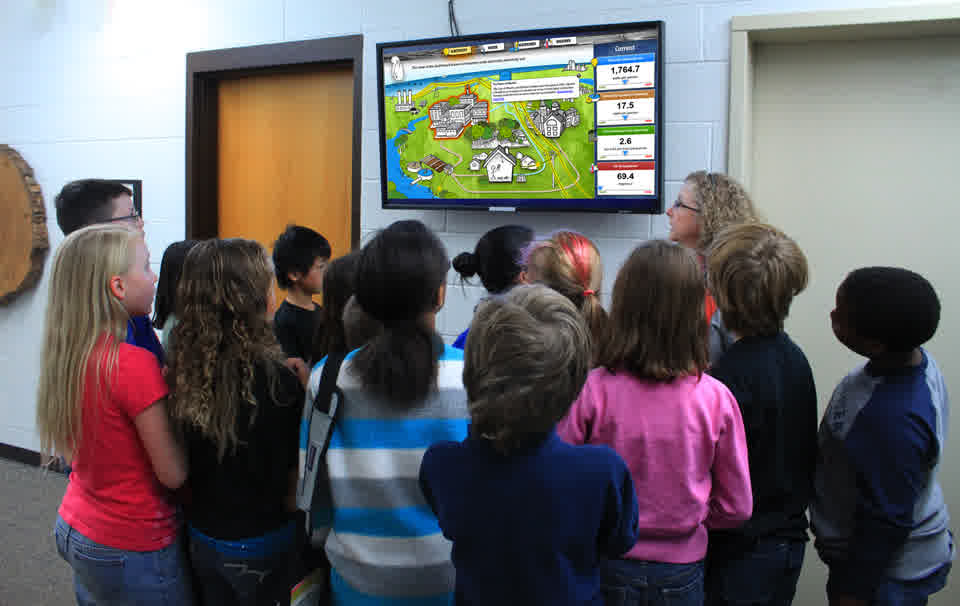
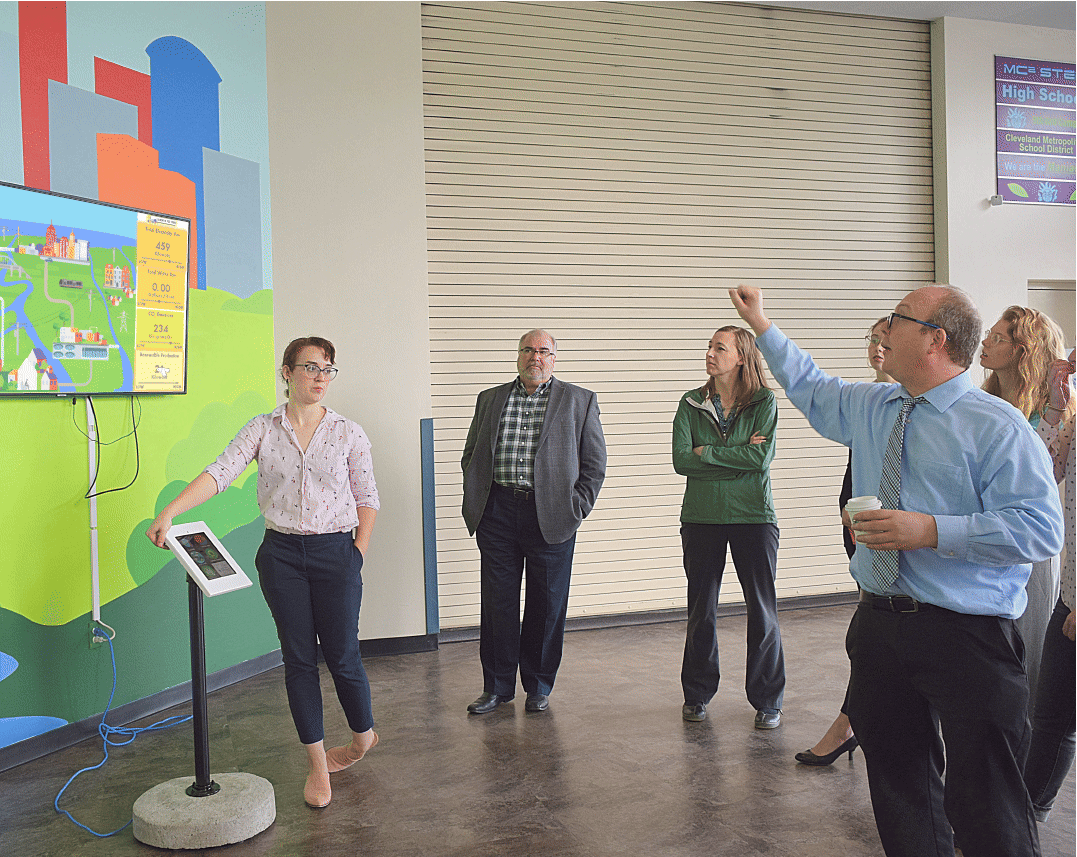
Hallway screens, animated stories and 35 free lessons that let students see how their school uses water and electricity.
Oberlin Public Schools
School district
Every building in the district on one dashboard, plus Ecolympics competitions that cut water and electricity use.
Colleges and Universities
Dorm competitions, orb maps and animated stories that make the campus a teaching tool.
Oberlin College
College
Campus resource dashboards, conservation competitions and Carbon Neutral Stories.
Museums
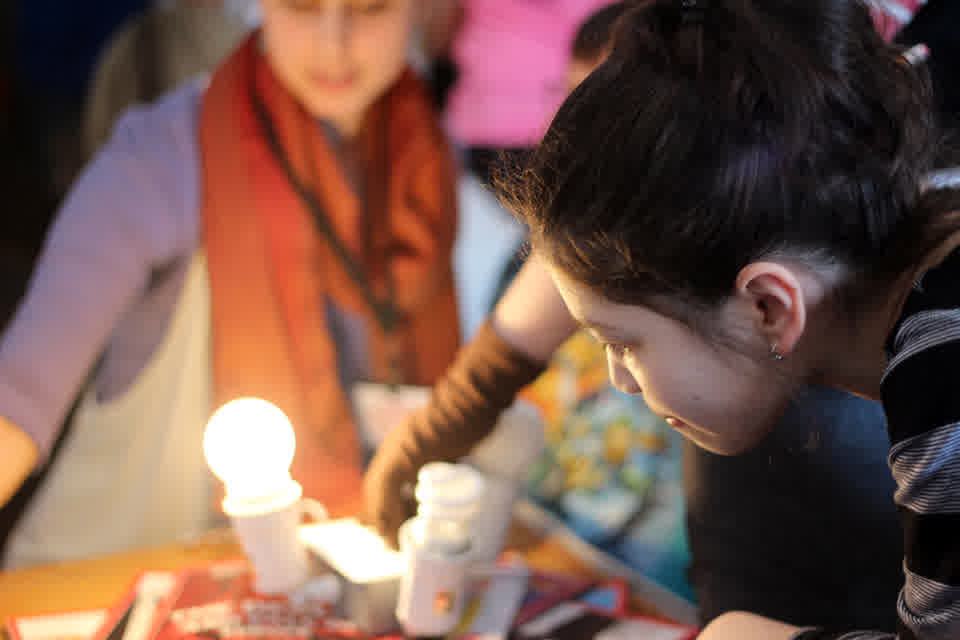
Live regional data and animated stories that turn exhibits on energy, water and air into real-time learning.
Great Lakes Science Center
Science center
Live air and Lake Erie data powering an interactive environmental exhibit in Cleveland.
Bring Dashboard to Your Community
The implementation guide, Bringing Environmental Dashboard to Your Community, covers the approach, technology and implementation.