Great Lakes Science Center
Live air and Lake Erie data powering an interactive environmental exhibit in Cleveland.
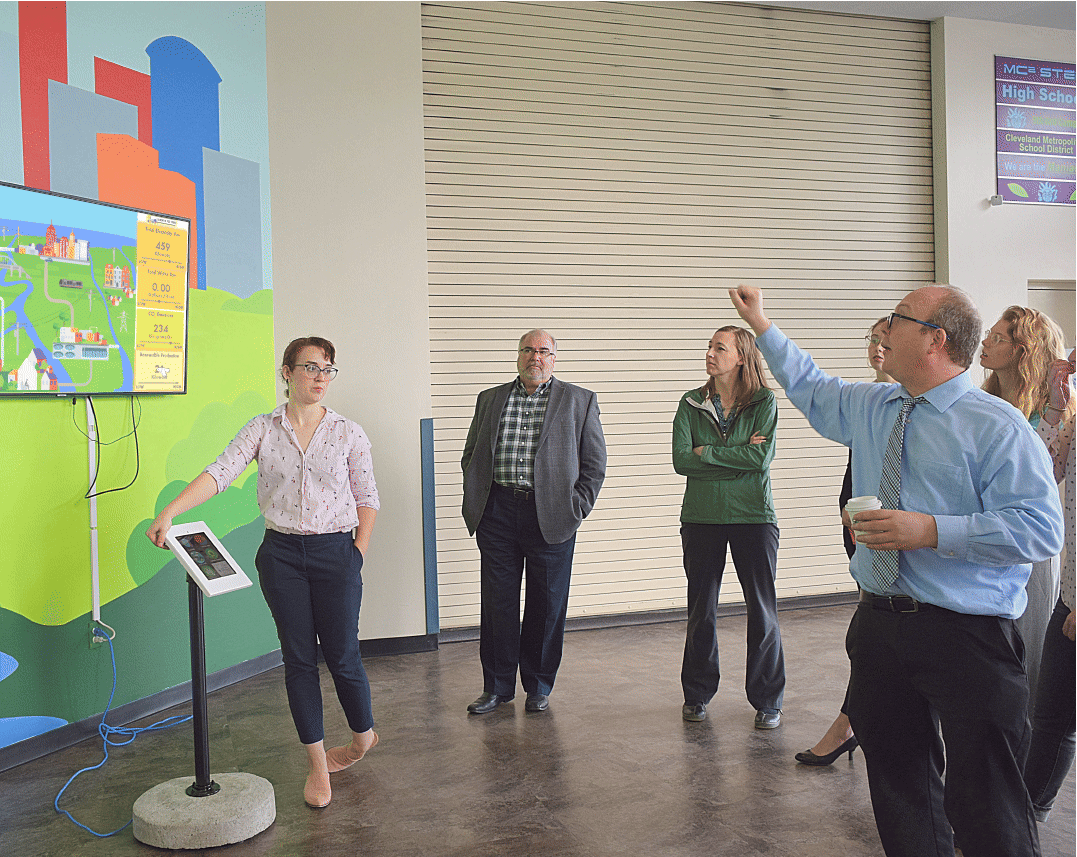
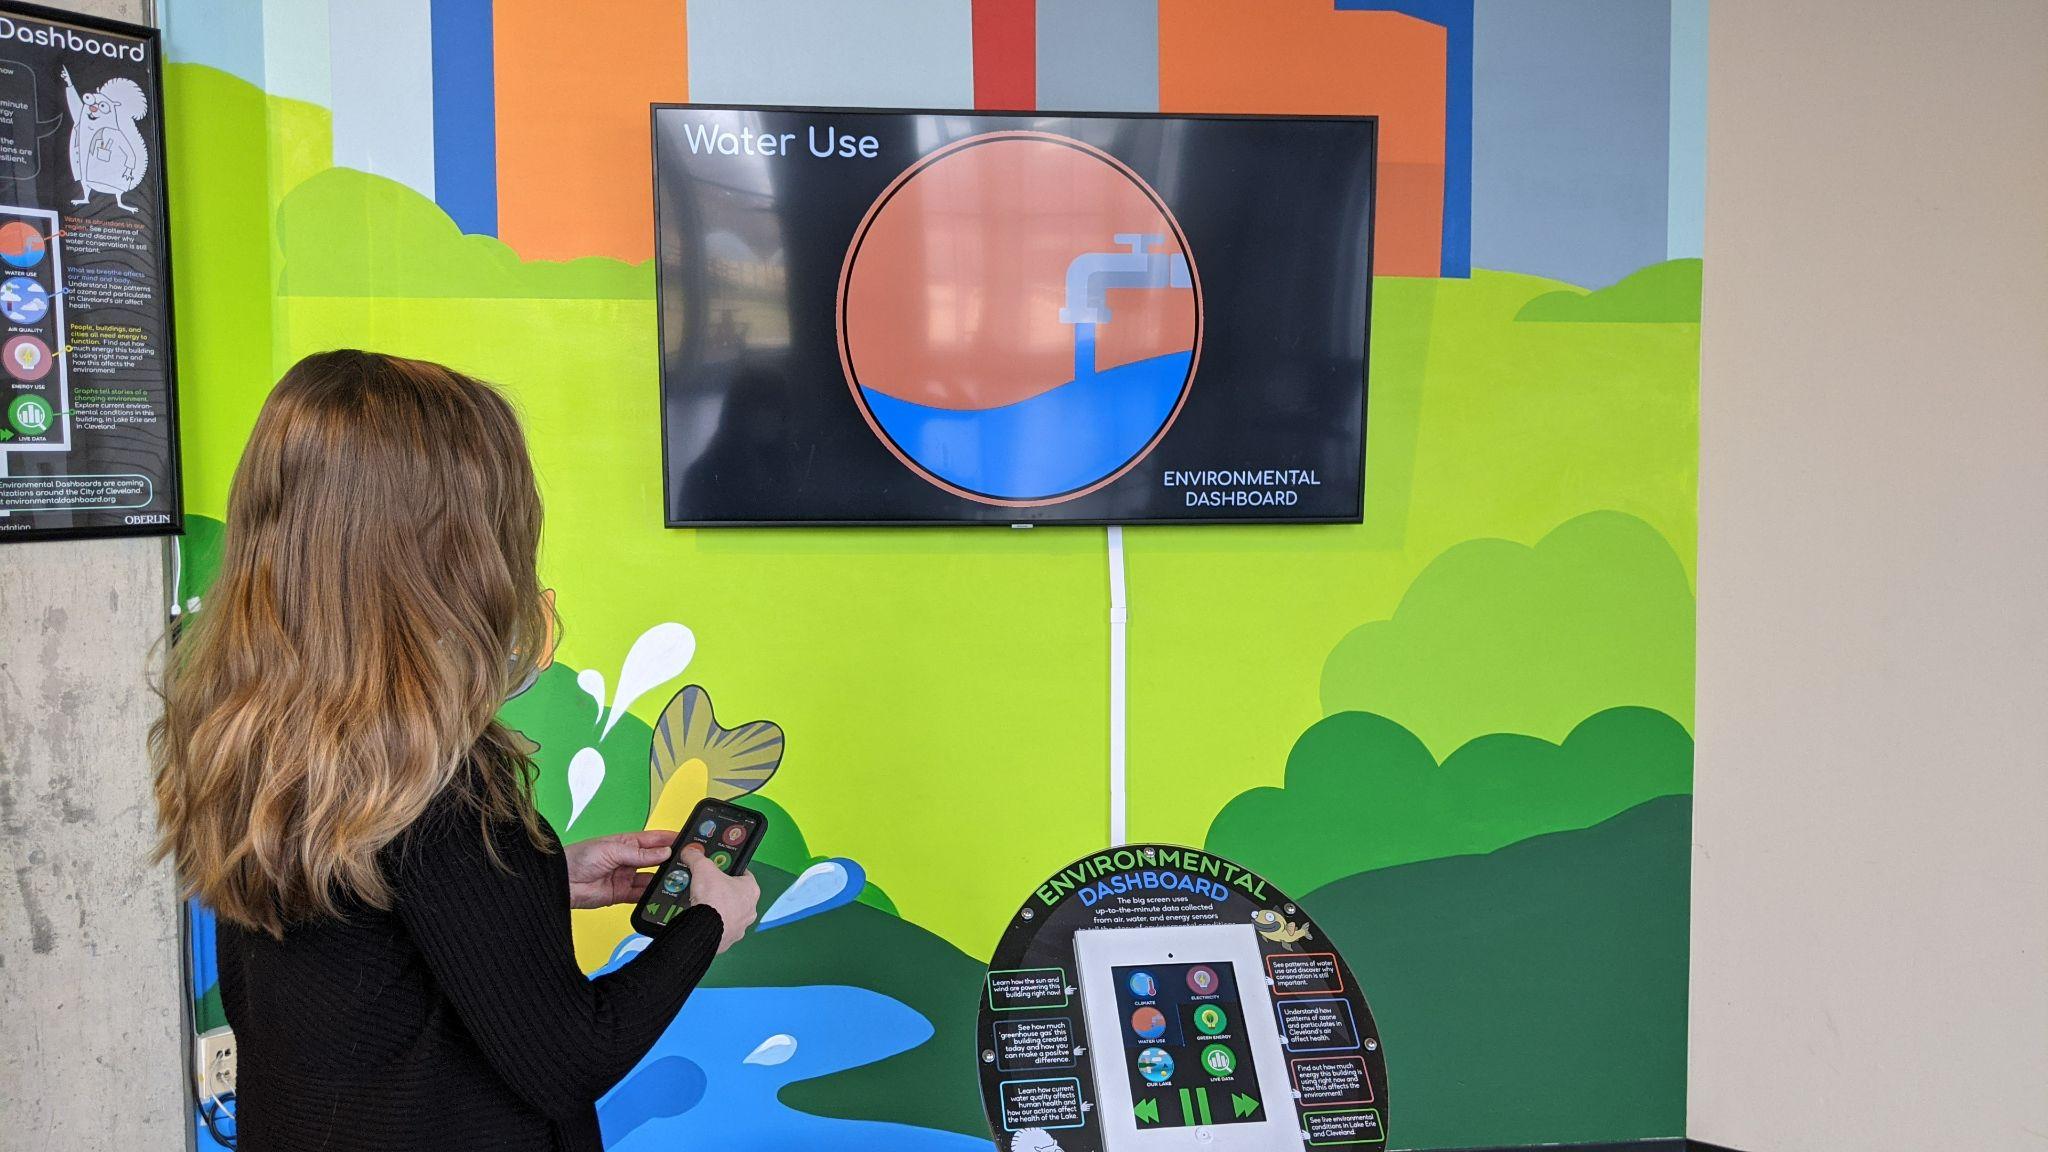
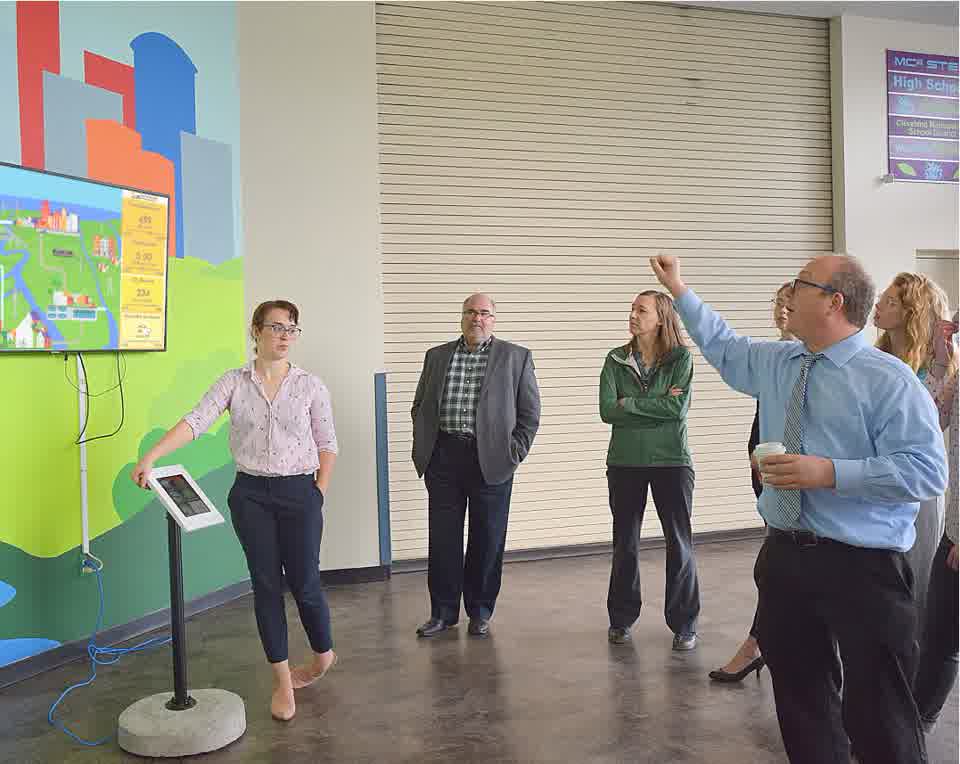
The Great Lakes Science Center runs an interactive environmental dashboard exhibit with a screen and a touch kiosk. Visitors control the display and see real data from their region.
Its data comes from the center’s own monitoring equipment, Lake Erie (USGS) and an EPA air quality station in Cleveland. Cleveland’s version of the Citywide Dashboard runs there.
The dashboard signage is stitching together the work of Cleveland organizations to make the team effort apparent.
In use here: Citywide Dashboard, Stories, Web Embeddables
See the live dashboardThe exhibit on the Science Center’s site (opens in a new tab)
Runs at cleveland.communityhub.cloud