Neighborhoods
Oberlin College electricity
Each orb sits on a building and shows how much of a resource it is using, such as electricity or water.
Dashboard demos
 Great Lakes Science CenterThe Cleveland Environmental Dashboard
 Oberlin City SchoolsEvery building in the district
 Oberlin CollegeDorms and campus buildings
 City of OberlinTown-wide electricity and water
 Data HubThe Oberlin Public Library's data
See it live
 OrbsOberlin College buildings, replaying yesterday's use
 Citywide DashboardOberlin's water, power and weather, animated
 Building dashboardOne building's use, in real time
 Community calendarThis week's events in Oberlin and Cleveland
 Community VoicesNeighbors' photos and words
 StoriesPlay an animated story with live data
Products
Building DashboardCitywide DashboardData Hub Digital Signage
 Phone App
 Web EmbeddablesCommunity CalendarCommunity VoicesStories
Who it's for
Building Dashboard tracks and communicates patterns of real-time resource use in buildings in ways that engage, are easy to understand and make connections between resource conservation and resulting environmental and community benefits.
Loading an Oberlin College residence hall dashboard…
Citywide Dashboard is an animated visualization of whole-community flows of electricity, drinking water, and current environmental conditions. It is designed to enhance residents’ understandings of how they are connected to a larger whole — a whole that is ultimately dependent on renewable resource flows and a healthy environment.
Loading Oberlin Citywide Dashboard…
Each orb sits on a building and shows how much of a resource it is using, such as electricity or water.
Each orb sits on a building and shows how much of a resource it is using, such as electricity or water. Here each orb shows the air quality at a spot in Cleveland. This demo runs on simulated readings.
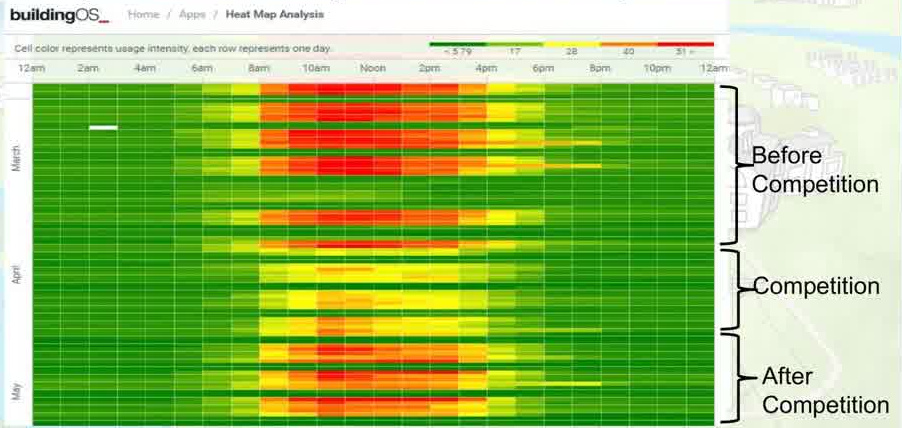
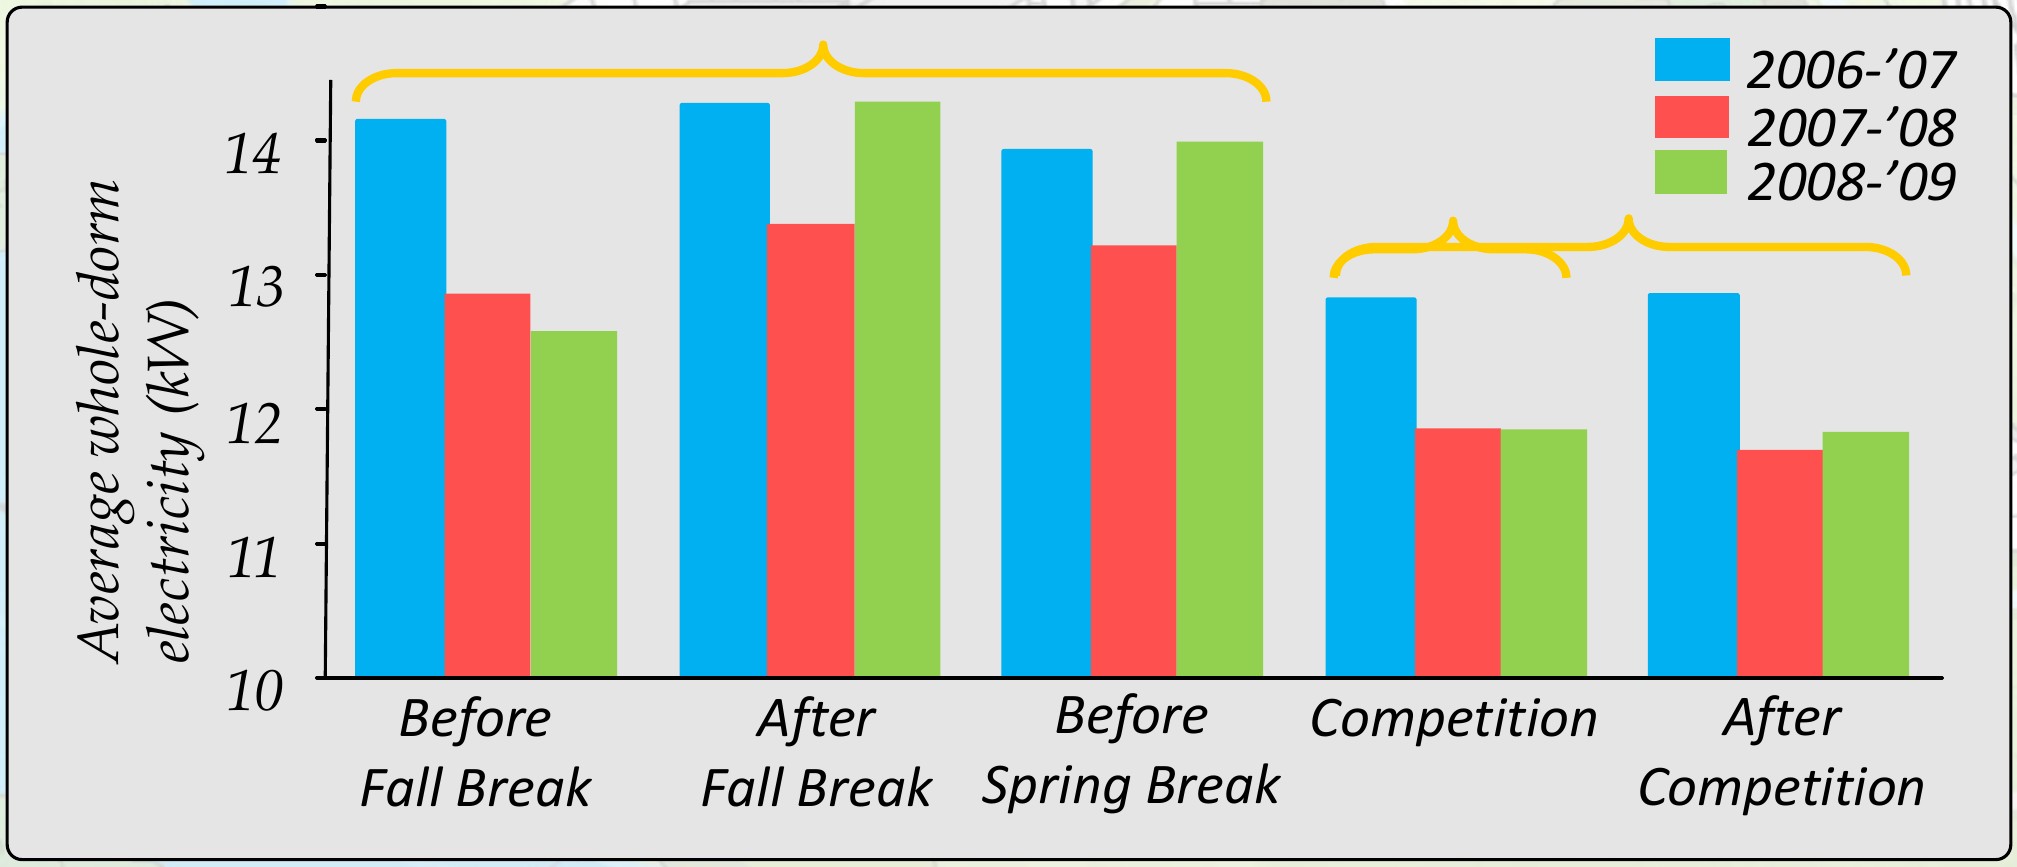
Ecolympics runs at the City Schools, community buildings and Oberlin College, with the biggest percentage cut against each building's own baseline winning.
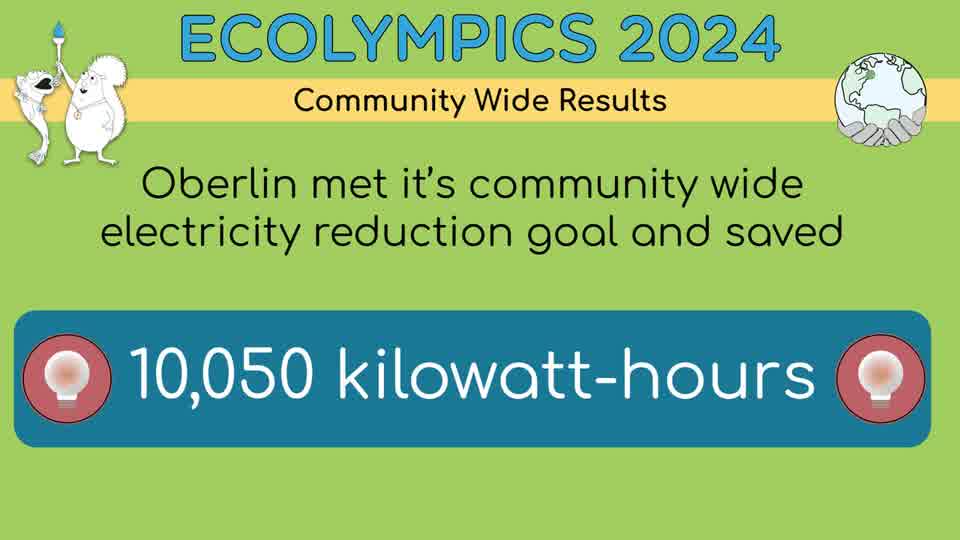
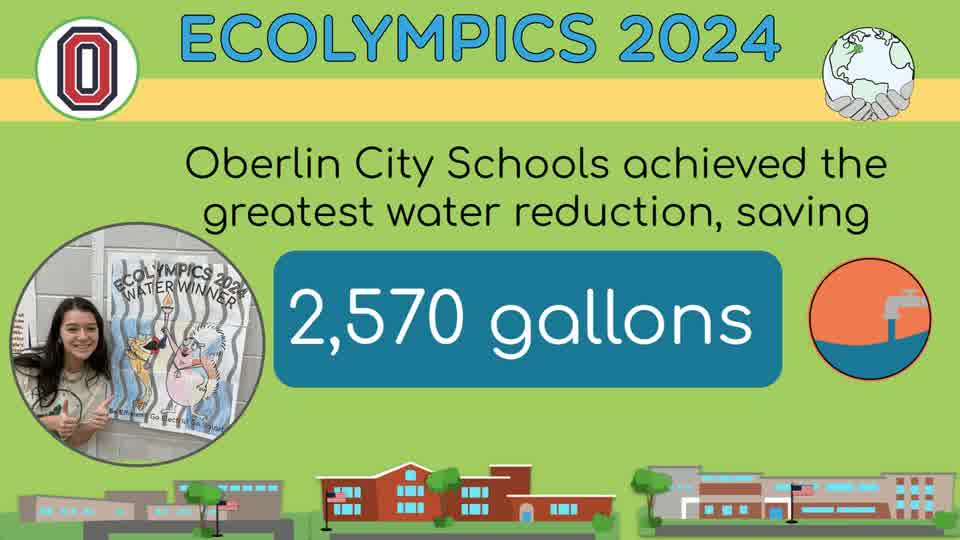
A heat map from Prospect Elementary and a results chart from the Oberlin College dorms, both during Ecolympics.
Oberlin's Citywide Dashboard combines data from the city's own utility, its water system and local weather and air monitoring.
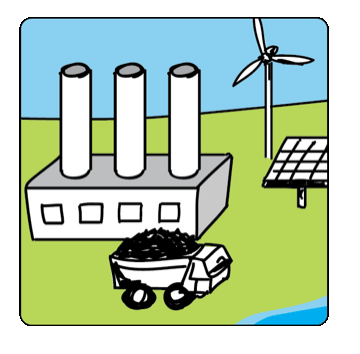 Oberlin Municipal Light and PowerWhole-city electricity. The community-owned utility was founded in 1934.
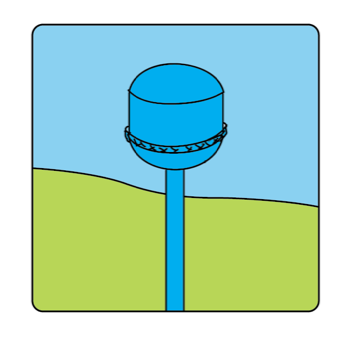 Drinking water plantWater comes from the West Branch of the Black River and is stored in the Parsons Rd reservoir, which holds 450 million gallons when full.
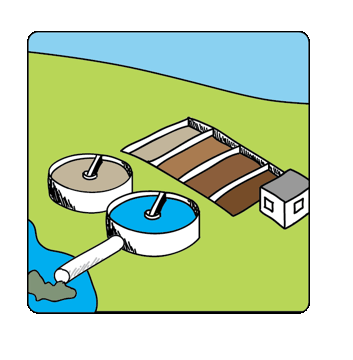 Wastewater plantTreated water flows into Plum Creek, whose watershed covers 12.4 square miles and is 60% farmland.
 Weather and airAir temperature and air quality, read through the day.