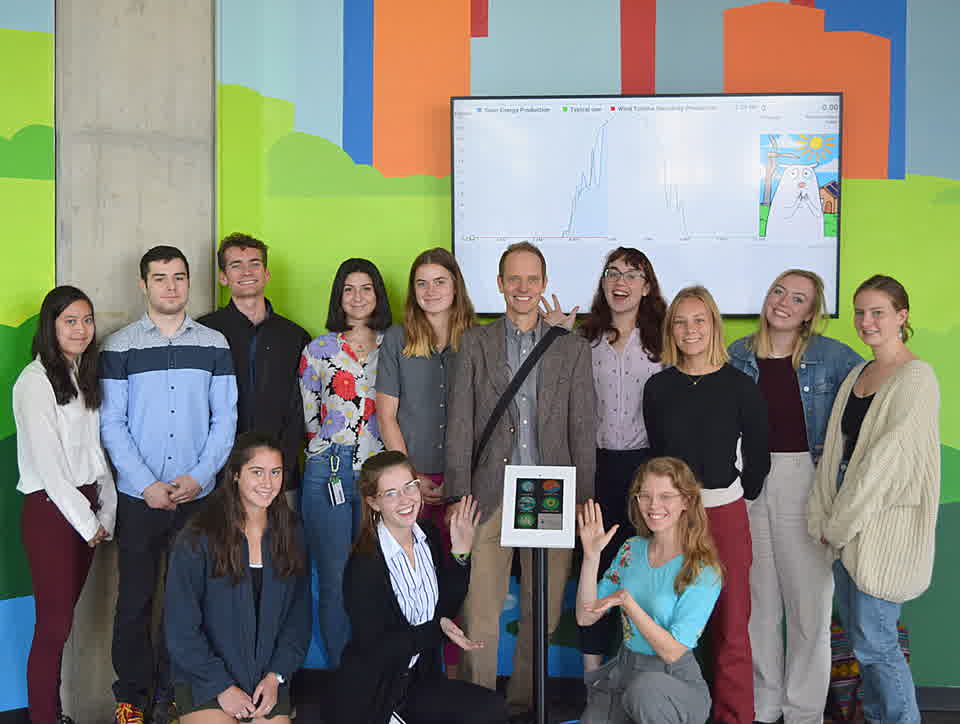
Digital Signage
 Phone App
 Web Embeddables
 Neighborhoods
Environmental Dashboard
Environmental Dashboard
For the vast majority of human history, we’ve lived in intimate contact with nature, our actions guided by the rapid and direct feedback provided by the surrounding environment.
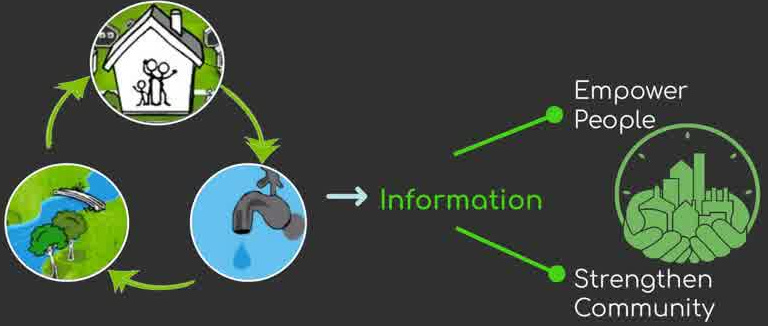
Fast forward to today, members of our industrialized societies spend most of their lives in cities and buildings, isolated from the environmental cues that once informed our decisions. The environmental and human costs of our resource use are out of sight and out of mind; The feedback system has broken down.
How can information feedback be used to empower people and improve the environment?
We believe that sustainability is best visualized when every level of a community is considered - its members, buildings, and city-wide resource flow.
The Environmental Dashboard is a product of that belief, intentionally designed to reintroduce the multifaceted, environmental feedback that’s been disrupted in recent human history - to reconnect people with each other and the natural world.
CommunityHub's individual products and services, together, become a set of tools that give communities the power to build, share, examine and celebrate their own Environmental Dashboards, their unique, multi-scale stories.
The pilot implementation of Environmental Dashboard was initiated in Oberlin, Ohio in 2008. Since its launch, the project has extended throughout Northeast Ohio and beyond, with various communities and organizations using CommunityHub technology and services to develop and customize Environmental Dashboards of their own.
Modes of information delivery
Oberlin's own numbers, read live from the same meters this page is describing.
Oberlin now
Reading the meters
Counting Oberlin's kilowatts.
 Calm
Calm Whole city electricity kW
 Oberlin College W per student
 Air temperature °F
 Air quality AQI
Examples
Three places Environmental Dashboard runs today
Watershed Stewardship Center
Water and stream data on public display, next to the Black River.
City of Oberlin
Whole community electricity, drinking water and wastewater, on 24 signs around town.
Great Lakes Science Center
A live museum exhibit on Lake Erie and Cleveland air data.
“Environmental Dashboard enables residents to understand their electricity and water consumption, which in turn helps prevent overuse.”