Phone App
 Neighborhoods
Great Lakes Science Center
 Case study, museum
The Great Lakes Science Center is a science museum in Cleveland. Its Cleveland Environmental Dashboard combines the museum's own sensors, Lake Erie data from the USGS, and an EPA air quality station. Oberlin College environmental studies students worked on the Cleveland Foundation grant behind the exhibit.
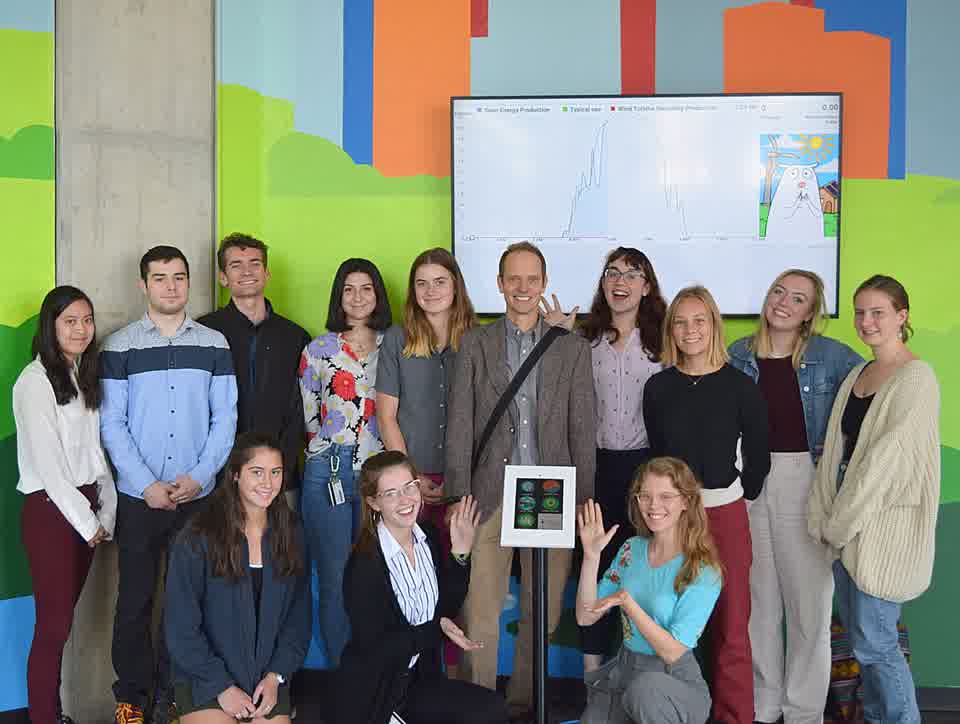
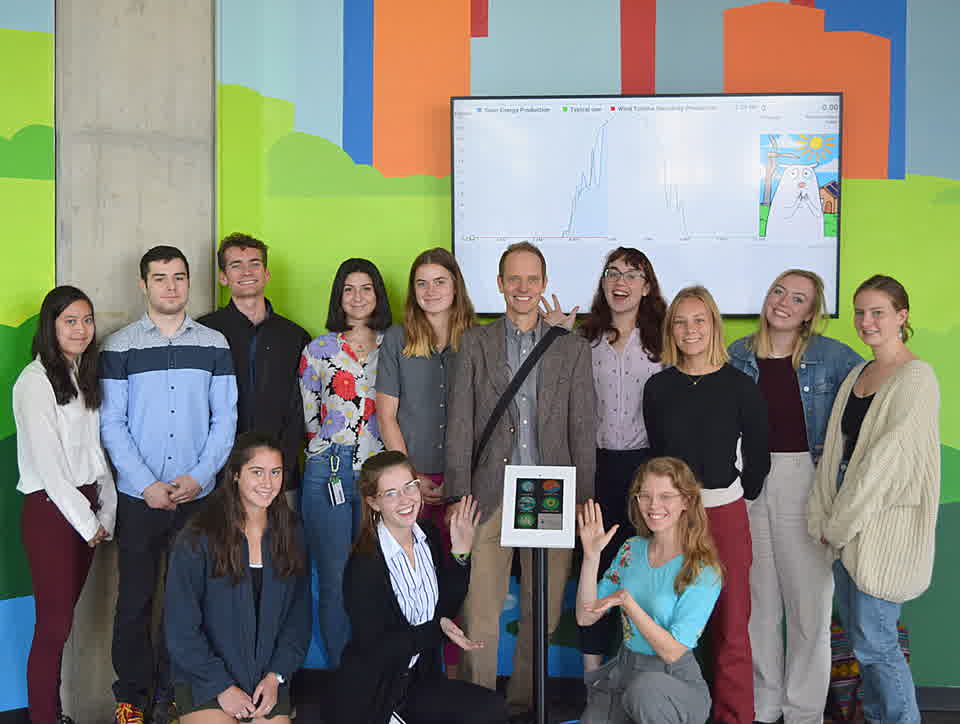
Dashboard workshop at the Great Lakes Science Center.
What feeds the Cleveland Environmental Dashboard
- Where
- Cleveland, Ohio
- Data
- Museum sensors, Lake Erie (USGS) and Cleveland air quality (EPA)
- Students
- Oberlin College environmental studies students
- Public dashboard
- Cleveland Environmental Dashboard
What feeds the Cleveland Environmental Dashboard
The dashboard is public, so the exhibit and the website show the same live data.
Modes of information delivery
 Data HubThe Cleveland Environmental Dashboard, built from the three live sources
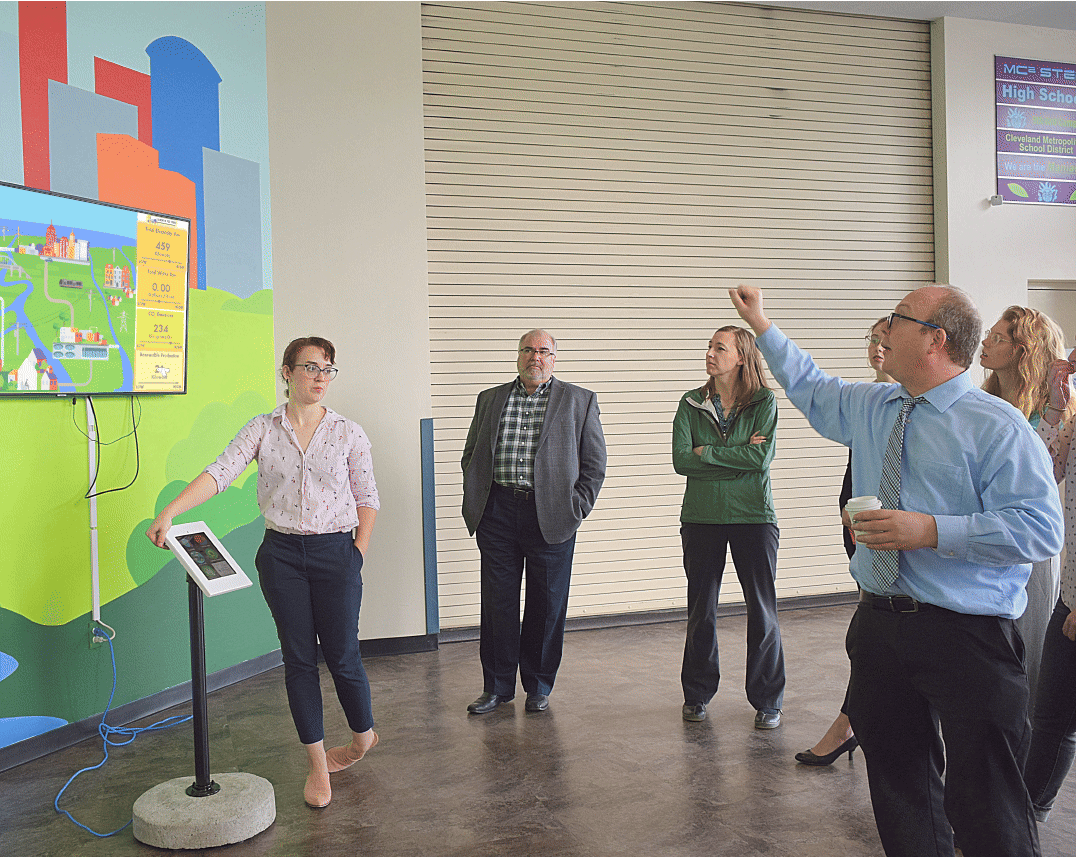
 Building Dashboard and Citywide DashboardA Citywide Dashboard drawn for Cleveland, on the exhibit screen
 Digital SignageThe exhibit screen, with a touch tablet on a stand beside it
 Web EmbeddablesAn embeddable version of the dashboard for websites
How people use it
Students
Oberlin College environmental studies students worked on the Cleveland Foundation grant behind the exhibit. In October 2019, students and staff held a workshop at the museum.
Anyone online
People can open Cleveland's lake and air data at home after a visit.
“The dashboard signage is stitching together the work of Cleveland organizations to make the team effort apparent”
Origin Story
Dates for the Great Lakes Science Center only. Community Hub's own history since 2000 is on the About page.
- October 2019
Students and staff hold an Environmental Dashboard workshop at the Great Lakes Science Center.
- Today
The Cleveland Environmental Dashboard is public online, and it's live further down this page.
The Cleveland Environmental Dashboard
Loading the Cleveland Environmental Dashboard…